
This is Part 1 of a sequence of posts. You can find Part 2 here and Part 3 here.
I recently had the following graph Tweeted into my timeline:

It is from the new PISA report, “Ten questions for mathematics teachers… and how PISA can help answer them.” It is an interesting report containing links to the data set.
The first thing that strikes me about the graph is that it says very little. There is not much correlation between the two measures and neither of them is a measure of maths performance. So what are we meant to conclude?
PISA asked students a number of questions and then developed an “index of memorisation”. For some reason, that’s not quite what has been plotted on the y-axis of their own graph (more later) but I decided to plot 2012 Maths PISA scores against this index. This is what I found:
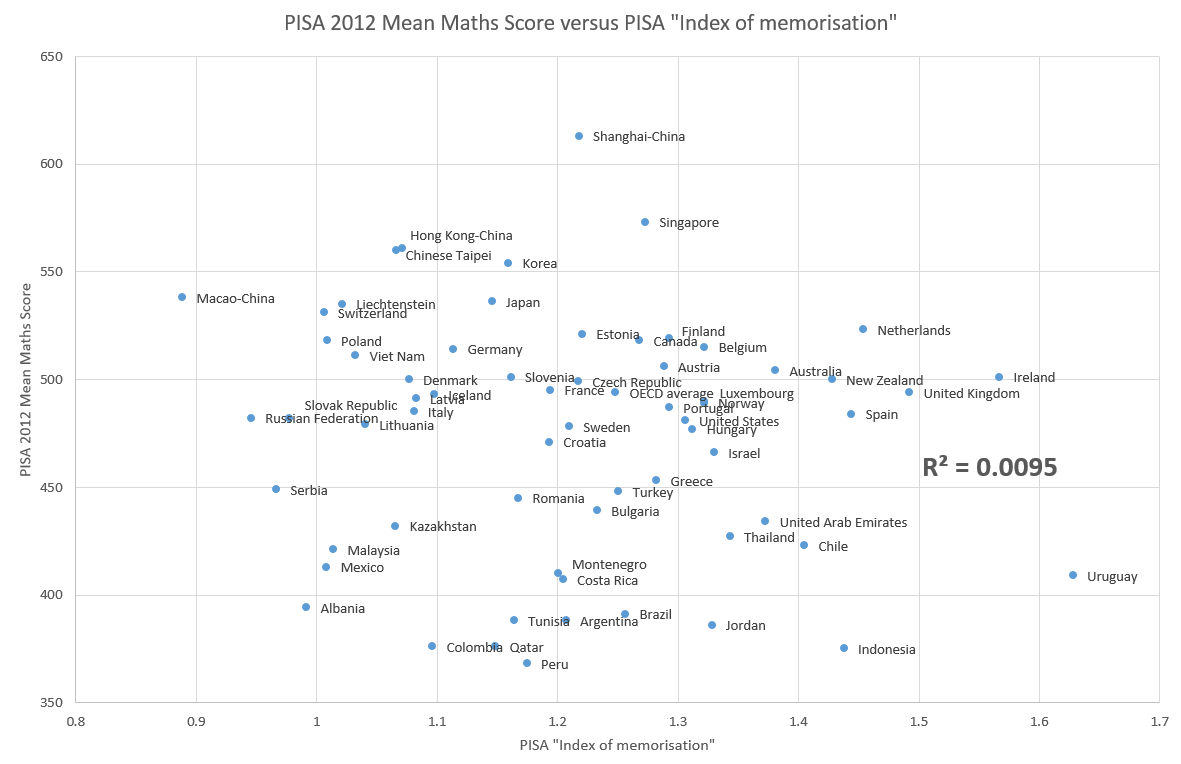
This is not a strong correlation, implying that either the degree of memorisation does not affect maths outcomes (maybe something like teacher quality swamps it) or that the construct that PISA have used – their “index of memorisation” – is flawed. Have a look at how they calculated it:
“To calculate how often students use memorisation strategies, they were asked which statement best describes their approach to mathematics using four questions with three mutually exclusive responses to each: one corresponding to a memorisation strategy, one to an elaboration strategy (such as using analogies and examples, or looking for alternative ways of finding solutions) and one to a control strategy (such as creating a study plan or monitoring progress towards understanding). The index of memorisation, with values ranging from 0 to 4, reflects the number of times a student chose the following memorisation-related statements about how they learn mathematics:
a) When I study for a mathematics test, I learn as much as I can by heart.
b) When I study mathematics, I make myself check to see if I remember the work I have already done.
c) When I study mathematics, I go over some problems so often that I feel as if I could solve them in my sleep.
d) In order to remember the method for solving a mathematics problem, I go through examples again and again.
Statement a) assesses how much students use rote learning, or learning without paying attention to meaning. The remaining three statements come close to the ideas of drill, practice and repetitive learning.”
The values that you get from this index range between about 0.9 and 1.6 out of 4. So that doesn’t strike me as a huge variation. I am not at all sure that questions a) to d) represent my personal concept of memorisation. And remember, students had to pick one of three options to each question. So they might not have been that enthusiastic about the one they chose. We don’t know exactly what the alternatives looked like but it might have been a case of rejecting those alternatives rather than positively selecting statements a) to d). [It would probably have been better to use questions with the stem, “To what extent..” and a Likert scale – the PISA approach reminds me of one of the flaws in the Myers-Briggs personality test].
We also have to bear in mind that these questions would have been translated into many different languages. The phrase “I learn as much as I can by heart” is quite idiomatic. It has positive connotations in English but do those translate? Was a different idiom used?
Instead of plotting their own “index of memorisation”, PISA seem to have plotted the percentage average of how often a) to d) were selected by students*. This has the effect of changing the rankings quite a lot. Four of the top five on their plot are countries where students will have received these questions in English, which further supports the hypothesis that language might have something to do with it.
PISA further slice and dice their analysis by examining question a) only i.e. the question about learning ‘by heart’. So I plotted this against PISA 2012 Mean Maths Score:

The R-squared value is about 0.00009. Which is low.
In their report, the PISA authors attempt to construct the narrative that countries in the Far East are not as teacher-directed or reliant on memorisation as we might have assumed. There’s a little vignette about Japan and its “zest for living” reforms. This is interesting because I predict that when the PISA 2015 results are released in December, we will see a further entrenchment of Far East nations at the top of the table. Until now, educationalists in places like Australia have tended to be selectively blind to this, preferring to point to the examples of Finland and Canada – the Far East has been dismissed due to cultural differences.
Yet, Canada and Finland have both embarked upon reforms since 2000 that, in my view, have already impacted negatively on their international performance. If this trend continues in PISA 2015, as seems likely, then it may be harder to ignore the performance of the Far East. So perhaps we’re being subjected to a little early spin.
Note: Clicking on the graphs makes them larger and easier to see. You can find the source data here.
Update: after publishing this blog post I noticed that this data set is being used in an article in Scientific American, alongside some interesting neuroscience claims.
*this is not the case – see the later posts
This is Part 1 of a sequence of posts. You can find Part 2 here and Part 3 here.

Reblogged this on The Echo Chamber.
I find it interesting that some educationalists in Australia are harping on Canada’s performance, when it’s clearly declined significantly over the past decade, as highlighted in Dr. Stokke’s report https://cdhowe.org/public-policy-research/what-do-about-canada%E2%80%99s-declining-math-scores
Great Post. And thanks for sharing the data. My own analyses indicate that there is a.) no significant correlation between either the “index of memorization” and PISA math score nor between “% of students who learnt by heart”. Moreover, Bayesian correlations indicate that there is evidence in favour of the null for both correlations. That is there is more evidence in support of their being no relationship than there is evidence in support of a relationship between either measure of memorization and PISA 2012 Math score.
When Jo Boaler tweeted in delight that Ireland and the UK were the biggest memorizers of all I presumed she was suggesting (based on her disdain for memorization) that there was some awful correlation between that and poor performance — of course taken within the spectrum of PISA participants neither Ireland nor the UK perform particularly badly — only when judged against their past performance.
Boaler paid no attention, however, to the other axis of the chart: Student-Oriented versus Teacher-directed instruction. If one takes the data as meaningful and straightforward representation of the facts on both scales (I don’t — I think it’s seriously flawed and the reasons you give here are only the start!), then Boaler disparages anything approaching the top right corner — and strongly advocates for moving instruction toward the bottom left corner.
That’s where a certain cluster stands out:
Thailand
Jordan
Qatar
Malaysia
Columbia
Tunisia
Not one of these performed above 450 on the 2012 PISA. They are all disasters, educational basketcases. Says a lot about what Boaler is promoting.
In reality — and again, only if one grants legitimacy to this data — it is only particularly useful when plotted against a third axis, namely the PISA score or some other measure of achievement.
In general I would be very wary of data drawn entirely from a written survey of students from very different cultural and linguistic backgrounds. How students answer these questions is quite unpredictable and subject to cultural influences. I hadn’t even considered your excellent point here — that “committing to heart” is surely not a phrase that translates very accurately into other languages.
Further, I think anyone with a rudimentary knowledge of the educational systems in these various countries would be doing a double-take. UK the world’s greatest memorizers? REALLY?? In which version of reality? And Chinese Taipei … not?
Then one realises this isn’t even about mathematical instruction. The question you show here is about at-home study strategies of students. It would be ludicrous to infer anything from this about instruction. Or, perhaps one should infer something that might argue in the other direction.
Imagine you’re a kid in a “progressive education” math class. Your teacher is doing nothing to support mastery; you’re supposed to slowly absorb “understanding” as the spiral of learning slowly grinds upwards …
Then it is announced that there is a big test next week. And that a lot depends on it. What do you do? If you are at all interested in the outcome … you study. And … I bet … you cram. You … memorize.
Based on that thought experiment I would wager that students would self-report memorization as a study strategy at a HIGHER rate in school systems where there is a culture of regular testing combined with widespread teaching strategies that don’t support mastery from classroom work. Ironically, that would surely give a higher “memorization” score to school systems where memorization is disparaged and minimized in classroom instruction.
I think you may be right Robert. There’s an enormous difference between how the children choose to learn and how they are taught. If they are not taught basic facts in class then they will need to memorise them at home.
I find it incredible, in the literal sense of not credible that New Zealand is high on the “memorisation” table. That goes against everything I have ever seen about NZ teaching.
My personal take on it is this: some countries like NZ preach progressive learning, but actually tend to fall back on traditional techniques in practice, because they work better. The students see this as back-sliding, and think they are doing lots of “unnecessary” memorisation. Meanwhile countries that don’t make the kids feel that everything should be learned in a student-centred way are unlikely to see the memory stuff as anything out of the normal.
Reblogged this on From experience to meaning… and commented:
Interesting take on this PISA-report, looking forward to some responses of the PISA-community!
Thank you for this blog.
Even more informative, further showing that there are multiple issues with the conceot of memorization in the OECD reports, is this underlying working paper: http://www.oecd.org/officialdocuments/publicdisplaydocumentpdf/?cote=EDU/WKP(2016)4&docLanguage=En
Thanks, Christian. Is there anything specific that you would like to point out to those of us lacking technical expertise? If the response to this question is lengthy then I’m happy to offer you a guest blog (if interested).
You’re doing some nice things. Thanks for the offer. I might combine in a blog but to fit the dynamics of social media I’ll put in some comments here now as well.
1. All the statements since begin 2015, up into the last OECD ‘advertorial’ and Scientific American article are based on the working paper source (it took more than a year to get it confirmed by the main claimants of the memorization quote)
2. Check the first chapter and especially the diagram. It shows that the starting point already was to establish a link between teaching strategies and memorisation etc.
3. The report then goes into the specific test items. You flag up a good point on language (not unique to this, basically all comparisons, of course). But more importantly, we must keep on asking if maths is measured (to a very limited degree, I would say). OECD themselves are, as stated in the first chapter, more into the ‘four Cs’ and their maths items are more ‘problem solving’. As you describe, this means that all other statements are perceptions.
4. Then two chapters respectively go into teaching strategies and approaches to learning (memorization etc.). Strangely, for the teaching strategies Scales were used, but for the other a ‘trichotomy’. There is a convenient table with all three options for the four questions and their mapping to memorization, cognitive activation and another one (elaboration I think). You are right in suggesting you might disagree with their conception of these items. It’s in the wording, it’s in the items having separate elements (“I like apples or pears”, agree?, do you like both then?), but foremost it’s in the mutual exclusiveness. Based on cogpsy I think it’s pretty clear that these elements go ‘hand in hand’. They should have used a scale. It can’t be saved imo.
5. You can see in the teaching styles chapter what happens if you do scales. You see that many countries simply don’t adhere to a black and white picture. That is apart from whether you agree with the definitions of teacher, student directed etc. I think it does not really fit definitions that others have used. My feeling was that ‘cognitive activation’ for example has several ‘discovery’ like elements.
6. Note that technically, OECD analysts are very good, but here you can’t make anything from the memorization items. It is not acceptable in my opinion to make strong statements about it. Teaching strategies -like Schwerdt and Wuppermann, and Blazar is better, but caution always needed. For a nice recent paper on this with PISA 2012 data see Caro, Lenkeit and
7. Of course there also are several other PISA restrictions. I wish I could already post article und review with reunolds and others on this, I’ll try to blog but I am not such a consistent and regular blogger as you.
The OECD Education chapter is bullshitting the world with diagrams like the ones you showed. It goes against the grain of (implicit) academic codes of scientific research and its reporting. F.e.: there are huge questions of validity of the measures used, especially so in this comparative context. Much of what one needs to know about validity issues: the APA/AERA/NCME The Standards for Educational and Psychological Testing http://www.apa.org/science/programs/testing/standards.aspx
The first thing I noticed in the first graph: the peculiar position of France, after de Jospin Act of 1989 instruction is student-oriented ! With dire consequences (Hirsch, 2016: Why knowledge matters)
Surely the Scientific American article will be challenged! Greg (and others above), would it be worthwhile sending them your analysis of the PISA data?
Pingback: PISA data gets curiouser and curiouser | Filling the pail
Pingback: PISA data contains a positive correlation | Filling the pail
Pingback: The PISA definition of good teaching | Filling the pail
Pingback: PISA Mathematics Lessons: Why Zero-In on “Memorization” and Minimize Teacher-Directed Instruction? | Educhatter's Blog
Pingback: Why the Scientific American article on maths education doesn’t add up | Filling the pail
Pingback: PISA results are in… | Filling the pail
Pingback: Three myths about PISA | Filling the pail
Pingback: OESO-rapport: Memorisers zijn losers – Beter Onderwijs Nederland
Pingback: OESO-rapport: Memorisers zijn losers - Beter Onderwijs Nederland
Pingback: Uitspraken Rekenen Deel 2 - Beter Onderwijs Nederland
Pingback: Jo Boaler - Beter Onderwijs Nederland
Pingback: Five ways to damage a good school | Filling the pail
Pingback: The man from Opposite Land | Filling the pail
Pingback: A review of Mathematical Mindsets by Jo Boaler: Part I | educationandstuff
Pingback: Mary Bousted and 21st century skills – Filling the pail
Pingback: How Andreas Schleicher Learned to Stop Worrying and Love Teacher-Directed Instruction – Filling the pail
Pingback: Is Singapore a bastion of educational progressivism? – Filling the pail