

The Programme for International Student Assessment (PISA) is run by the OECD which conducted its last round of testing in 2018. The long-awaited results of PISA 2018 have just been published. I am not interested in absolute scores and overall rankings because so much can vary between different countries and states: socioeconomic status, homogeneity of population, prevalence of tutoring etc. Instead, I focus on the direction of travel of different education systems.
I will post more analysis as I have it, but I will start with a few headlines.
Firstly, the darling of progressive educators everywhere, Finland, continues its unrelenting slide in performance since 2006:
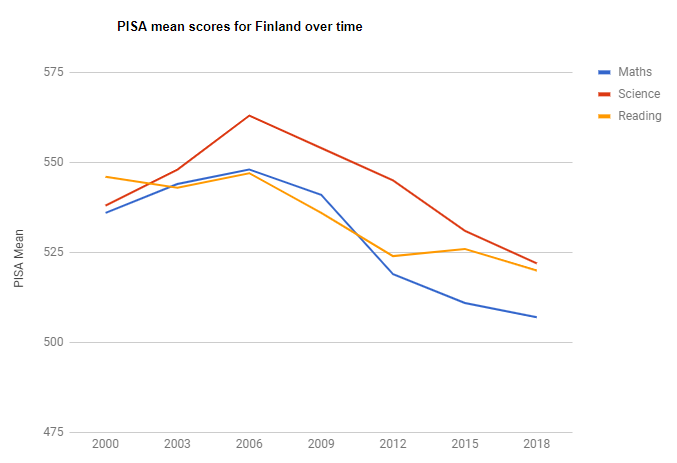
Finland made its name in the early 2000s on the basis of students who had received a pretty didactic and traditional educational experience. However, when anglophone observers then visited the country, they looked at it through the lens of their own ideology and attributed Finnish success to progressivist approaches. It seems that Finland was taken in by some of this hype. They introduced ‘phenomenon-based learning‘ and a range of other more fuzzy approaches. We cannot know for sure what has caused Finland’s decline, but the data is highly suggestive that any changes made in the last 10-20 years have not been for the better.
Which is why, finally, Australian educationalists should put to rest any ideas that contemporary Finland is the system to copy. Australia has continued to decline in all but its mean reading score, which has flat-lined:
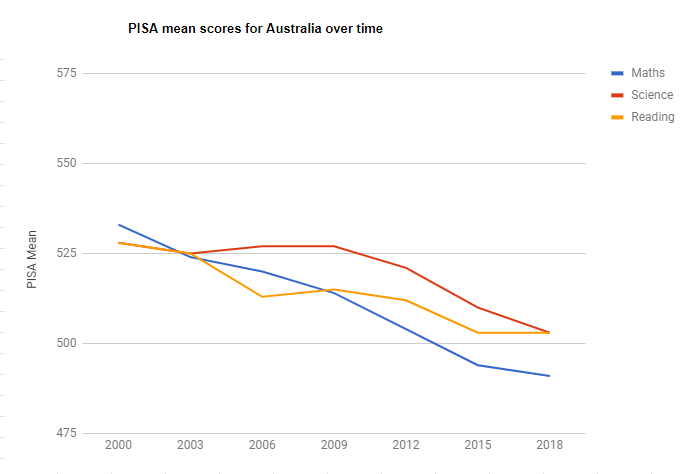
If we are going to learn from anyone, it should be systems that have been improving rather than declining. At present, our grand plan is to adopt practices that were abandoned in England nearly a decade ago, while the state governments push an agenda of reduced accountability, as if smashing the thermometer will stop your house from getting cold.
I do not yet have the dis-aggregated data for England, but, in terms of population, it forms a large proportion of the United Kingdom and the UK seems to be improving in reading and mathematics, even if the science score may be slipping a little:

England has made efforts since 2010 to adopt more of a knowledge-rich curriculum. If E. D. Hirsch Jr. is correct, this should eventually lead to an improvement in reading comprehension and so the reading result may possibly reflect such a process. There has also been a renewed emphasis on maths teaching, with the introduction of ‘maths hubs‘ to push best practice based on Chinese-inspired explicit teaching approaches. Again, we cannot be certain that these results have been caused by these policies, but it at least gives us a hint.
What we can no longer point to is any broad evidence from PISA that adopting progressivist education policies is associated with higher performance. And before you dismiss the PISA evidence, bear in mind that these are not tests of recall, but are attempts to test students’ ability to apply reading, maths and science knowledge to relatively complex real-world problems. I suspect that the intent was to give progressive practices the most favourable playing field as possible on which to compete.
What kind of improvement in a school system would not lead to an improvement in students’ abilities to apply what they have learnt to complex, real-world problems?
I cannot think of any.

Thanks for posting this. It seems that the inquiry based learning, which has been around and promoted by academic trainers for at least a decade is not working out. Does anyone know how they calculate the PISA scores. How old are the students or is it averaged across all grades?
It is a test of a representative sample of 15-year-olds in each education system
Thanks.
My take is that the reading scores in England have not significantly changed since last time despite the fact that this is the first cohort of children who had mandatory systematic phonics. The scores in England are not different from Australia and the US that do not have required systematic phonics. They are lower than Northern Ireland and Canada that do not required systematic phonics. The case for systematic phonics keeps getting weaker. See: https://jeffbowers.blogs.bristol.ac.uk/916-2/
Let me guess – you think a largely untested morphological approach to teaching early reading that your brother developed would be a better bet? PISA really is a magic mirror.
No, like I’ve said over and over, researchers need to realise that there is little or no evidence that systematic phonics works better than common alternative methods, and that we need to start looking at alternatives. I think SWI is promising, but I am clear that more evidence is needed.
It is the proponents of systematic phonics who keep claiming that the data strongly supports their view, and who do not address the problems that I (and others) have detailed. Does it not worry you that systematic phonics has not improved SAT, PIRLS, nor PISA results? That meta-analyses do not show evidence that systematic phonics works better than alternatives? The animosity to SWI in the face of these outcomes is hard to understand.
p.s., neither of us developed the SWI approach to teaching literacy.
Both PIRLS and PISA have seen small upticks in reading comprehension performance and yet both would only involve the very earliest cohorts experiencing the new phonics approach in the UK. The phonics check was only trialed for the first time in 2012 (I think). You dismiss this as no evidence for phonics just as you dismiss all the accumulated experimental and epidemiological evidence because it does not meet the gold standard of evidence you apply. However, you then pivot towards SWI, a programme that certainly does not meet this standard of evidence or any other I can see and that relies implausibly on the premise of teaching morphology to five-years-olds. I think there’s a problem with that argument.
PISA 2018 executive summary “The mean scores in reading and science in England have not changed significantly over successive PISA cycles, but in mathematics, England’s overall mean score showed a statistically significant increase compared with PISA 2015”. The PIRLS results have not increased in state schools in England in the last round (despite increases in PSC scores). The SAT results provide no evidence that phonics has improved outcomes in England, nor have the meta-analyses. The meta-analyses do not support the claim that systematic phonics works better than alternative accounts, I don’t know what you mean be epidemiological evidence, but there is no evidence anywhere I can see.
It is for this reason I’m arguing that we need to consider alternative approaches. Why would you discourage more research into the hypothesis that instruction should be guided by the logic of the writing system? I agree more evidence is required for this hypothesis, but you and so many others seem to dismiss it out of hand, Because the evidence of phonics is so good?
I have an English daughter who was (PISA-unsampled) 15yo in 2018 & her cohort were *not* the first with mandatory phonics. That was formally introduced for Year 1 kids in 2012 when she was three years ahead in Year 4. Some schools here & there had already started phonics after some TV program & press made a fuss about the benefits, but it hadn’t gone national.
Nevertheless, the small improvement in reading in PISA 2018 proves phonics doesn’t work and we need an entirely new approach based on morphology instead 😉
Hi Jeff,
you frequently make the claim that there is no evidence for systematic phonic instruction. Several phonics proponents have brought Project Follow Through to your attention. http://www.nrrf.org/learning/project-follow-through-findings/
Project Follow Through spanned almost three decades, & involved data collection from almost 10,000 participating students, as well as data collection from students outside of the study. “The result: children taught to read with direct instruction in intensive, systematic phonics vastly outperformed other children.”
Project Follow Through is a hugely important study, and any outright dismissal of the value of DI and/or systematic phonics in early years needs to account for these extraordinary and well-documented results.
You mention that neither yourself nor Pete Bowers developed the SWI approach to teaching literacy. Where would someone go to find information on this person – their credentials and experience for instance? Before we start ‘looking at alternatives’ to the approach so compellingly documented in Project Follow Through, it would be necessary to have a thorough & shared understanding of any such alternative method, including names & histories of key people involved, as well as of course theoretical underpinnings.
We have had this discussion before. Apart from not using the term “phonics”, and not focusing in reading per se., there are serious problems with the evidence from project follow through as you can see here: file:///C:/Users/psjxb/AppData/Local/Packages/Microsoft.MicrosoftEdge_8wekyb3d8bbwe/TempState/Downloads/TechnicalReport-ReadingMasteryandWWC_2008-4%20(2).pdf
I don’t see any of the main proponents of systematic phonics in the research community citing this work. Why not? My review summarizes all the meta-analyses that have been published that specifically assess systematic phonics. Why focus on this project (not focused on reading) and ignore the 12 meta-analyses specifically assessing the evidence for systematic phonics (that consider all relevant work carried out). As we have had this discussion before, I’ll not continue with it.
No worries Jeff, we don’t have to continue with the discussion around the evidence/theory supporting phonics as underpinning comprehensive early literacy instruction.
There was a second part to my post though – “You mention that neither yourself nor Pete Bowers developed the SWI approach to teaching literacy. Where would someone go to find information on this person – their credentials and experience for instance? Before we start ‘looking at alternatives’ to the approach so compellingly documented in Project Follow Through, it would be necessary to have a thorough & shared understanding of any such alternative method, including names & histories of key people involved, as well as of course theoretical underpinnings.”
I’m still interested in your response vis-a-vis this.
We’ll all be off to Estonia soon . . . https://www.bbc.com/news/education-50590581
A much better analysis here:
https://minedu.fi/en/article/-/asset_publisher/pisa-2018-suomi-lukutaidossa-parhaiden-joukossa
It actually points out the importance of the concept of “statistically significant” and also points out where any slides are part of a worldwide trend, not just isolated to one country.
Finland is still definitely a country to watch, particularly in the sense that their much more integrated (than Aus, UK, US) system, which Estonia looked to and was inspired by, appears to have contributed to their success. I say this because their ascent has been very long-term, over decades, and corresponds very closely with the dramatic introduction of their integrated public school system in the mid-20th century.
Finland’s decline since 2006 has been statistically significant. Given PISA tests 15-year-olds, whatever innovations Finland has introduced since the late 1990s or early 2000s have been associated with a statistically significant decline in their PISA performance.
Your armchair conjectures about Estonia are amusing and ironic given the history of such analysis of Finland. If you want to venture down that rabbit hole then I suggest starting with this blog post:
https://pocketquintilian.wordpress.com/2018/02/11/what-about-estonia/
a lot of other things have been going on in that time period besides changes to the education system. I think it would not be appropriate to suggest that the curriculum changes are the cause of the decline in Finland (or anywhere else) with out ruling out all the confounds
Yes – this is the limitation of correlational evidence. I take it you therefore only accept evidence from randomised controlled trials?
I’d be more convinced that the cause of the decline was due to changes in education practice if there was some evidence about changes in education practice over the time course of the PISA decline.
The conscept of ‘statistical signficance’ is a much overblown, and dare I say, misunderstood one. At least I didn’t see one ‘p’ statistic in the linked article. But if one insists in using them, anything less that at the 0.001 level is playing darts. 0.05 is tantamount to chance (ie 1 in 20 studies will draw an erroneous conclusion).
To David:
The report I linked to is a government one intended for public consumption. It is likely that the statistical details – that researchers like us are able to read and understand – are available on request. It is still a valid document to use as supporting evidence.
A decline can be “statistically significant” or not depending on the year you take your readings from. So if you stretch the starting year back a couple of decades (before PISA but when similar international tests were able to provide a decent indication of success) it starts to look more like regression to a (very high) mean.
I’m not sure why you are calling my comments “amusing armchair conjectures” – is this an example of passive aggression? My observations about Estonia are based on more than just old blog posts that pre-date the information we have just been given (and which omit statistically important information).
I am not sure ‘statistically significant’ conclusions can be drawn from extrapolating back to a time before such data was collected.
I simply find it amusing that people are now making exactly the same distorted claims about Estonia that they used to make about Finland – it is the cycle of life, I guess. That’s what happens when you look through the lens of your own ideology.
“a time before such data was collected”
The IEA has been collecting exactly the same type of data since 1958. They are responsible for PIRLS and TIMSS, as well as their predecessors. I have not seen anything to show that PISA data and the tests from the 60s to the 90s cannot be part of the same data set – the literature seems to have no problem with including all sets of data in the same continuum.
And can you state what you mean by “distorted claims”? I’m seeing all sort of explanations but nothing that could be described as “distorted”.
I spoke to a nephew who is 15 on his view of this: here ’tis. “kids don’t read anymore, they are always on their phone playing games or social media. Reading is not encouraged at school, and we spend too much time on political stuff [he means aboriginal/climate, I think], we waste our time on ‘learning projects’ that mean nothing and we have too many stand in teachers.”
Jeff: I’m very much in favour of teaching children about morphology, but only once they’ve mastered the way that grapheme-phoneme correspondences work in simple words of just one morpheme (e.g. cat, dog, run, sit etc.). You, however, seem to envisage teaching GPCs and morphology together right from the start, and I don’t see how this would work in practice. I asked about this recently elsewhere, but you didn’t reply.
On 6 November, you wrote ‘SWI does explicitly teach GPC, but in the context of morphological matrices where the meaning of a set of morphologically related words are studied. Here, children are being taught meaning of *written* words, and learning GPCs in this context.’
On 8 November, I wrote ‘Would you use a morphological matrix to teach GPCs from scratch to children who as yet knew no GPCs? Can you give an example?’
(https://pamelasnow.blogspot.com/2019/11/trick-or-treat-more-nonsense-words.html – see comments)
An answer might help me to understand your position with regard to real beginners.
Hi Jenny, you can give a child a matrix with as the base, and include , , . , , , etc. Tell them what the words are, show how they share meaning and spellings, and go through the GPCs. (looking at the GPCs within a word is similar to analytic phonics, but here, organized in morphological families).
Jeff: I don’t understand ‘you can give a child a matrix with as the base’ – has a word been omitted there? I really would like you to give an example of a matrix suitable for children who as yet know no GPCs.
Sorry, you can give a child a matrix with the base, and you can build words around that, e.g., . You then break down the word cat into its graphemes. (you might have to tell child that this written word spells cat, and then teach the relevant GPCs). That is like analytic phonics, but in the context of morphology. Check out our papers that include links to videos.
Hi Jenny, sorry, it should have said: ‘you can give a child a matrix with as the base’. You tell child that this word spells and teach him/her the graphemes that it contains (like analytic phonics, but in the context of morphology). I tried sending a similar note before, so sorry if I’ve replied twice!
Pingback: It is time to tackle Australia’s entrenched behaviour crisis – Filling the pail
You say, Jeff, that ‘you might have to tell the child that the written word spells cat, and then teach the relevant GPCs’. You WOULD have to do both these things if the child was a beginner, and that beginner stage is where I find it difficult to see how SWI would work.
If the base word were ‘cat’, you might add ‘s’, ‘ty’ and ‘ily’ (anything else?), telling the children at each point the spoken form of the word and the GPCs (7 in total). What activities would you provide to ensure that the children remembered what had been taught and could apply it to the reading and spelling of words not used in teaching? These are important considerations for synthetic phonics teachers – e.g. the first few GPCs are carefully chosen so that they can be used in as many simple words as possible, and children are given lots of practice to help them remember and apply what has been taught.
I’ve watched your videos in the past and don’t remember anything that would answer my questions, but will try to watch them again.
Pingback: A PISA Crap – BAD MATHEMATICS
You say, Jeff, that ‘you might have to tell the child that the written word spells cat, and then teach the relevant GPCs’. You WOULD have to do both these things if the child was a beginner, and that beginner stage is where I find it difficult to see how SWI would work.
If the base word were ‘cat’, you might add ‘s’, ‘ty’ and ‘tily’ (anything else?), telling the children at each point the spoken form of the word and the GPCs (7 in total). What activities would you provide to ensure that the chidren remembered what had been taught and could apply it to the reading and spelling of words not used in teaching? These would be important considerations for synthetic phonics teachers – e.g. the first few GPCs are carefully chosen so that they can be used in as many words as possible, and children are given lots of practice to help them remember and apply what has been taught.
I’ve watched your videos in the past and don’t remember anything that would answer my questions, but will try to watch them again.
I expressed myself a bit carelessly above. I DO know that the suffix in ‘catty’ is actually ‘y ‘, but that as ‘y’ is a vowel here, the ‘t’ of ‘cat’ has to be doubled. I also know that ‘cattily’ is ‘catty’ + ‘ly’, with the ‘y’ of ‘catty’ changed to ‘i’. In both cases, the changes are made according to rules. I was thinking more in terms of the LETTERS that the rules require.
Pingback: Fiddling with NAPLAN while PISA burns – Filling the pail
Pingback: Australia and Finland slide further in PISA 2018 — Filling the pail – Truth Troubles
Pingback: Australia’s PISA Shock - Quillette
Pingback: Learning progressions are invalid and inequitable – Filling the pail
i would say, that the way you approach to PISA results is completely off the intended use. PISA test is not like a testing how fast 15 years old kids can run on 100 m distance. in that situation you can measure 5000 kids in a country, make an average, repeat that every 3 years and than you can say the ability to run fast on 100 m distance has declined over 15 years time, and maybe you can add some comments why. but this is not PISA, every time the PISA test happens, the tests are different. there is lots of data hidden in all those hundreds of pages published every time with PISA tests, but the shallow conclusions you are trying to make here are stupid and definitely out of the realms of intended use of that data. but in this age, who would read all those pages, when you can write a blog based on one graph?
Pingback: Finland, schools, and PISA | justbargain
Pingback: Decluttering the Australian Curriculum | Filling the pail